Indoor Object Detection
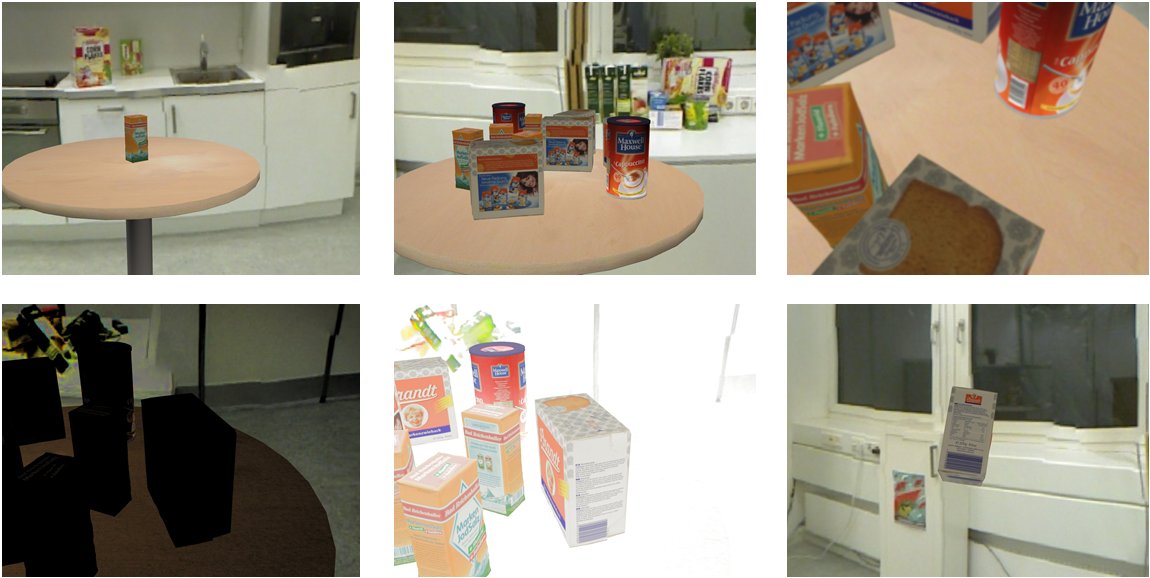
R3-COP (“Resilient Reasoning Robotic Co-operating Systems”) was a European ARTEMIS-project that ran from 2010 to 2013. In this project, VITRO was designed, developed, and applied to the visual component of a home robot that should recognize packed food items on a table, grasp them and put them to a predefined location. VITRO was used to assess the robustness of the robot’s vision system with respect to lighting, orientation, distance, and type of objects.
Please note that these example results do not represent the performance of the final system! They shall only demonstrate the potential of VITRO!
Following diagram shows the ability of a tested algorithm to detect and locate a certain object depending on its orientation around its z-axis and distance from observer. The orientation is given in degrees, the distance in units between 0.0 and 1.0. Each dot/cross represents a generated test case. Coloured dots denote successful detection, with colour corresponding to the algorithm’s own confidence measure, and with size representing the location error against GT. Grey crosses denote no detection.
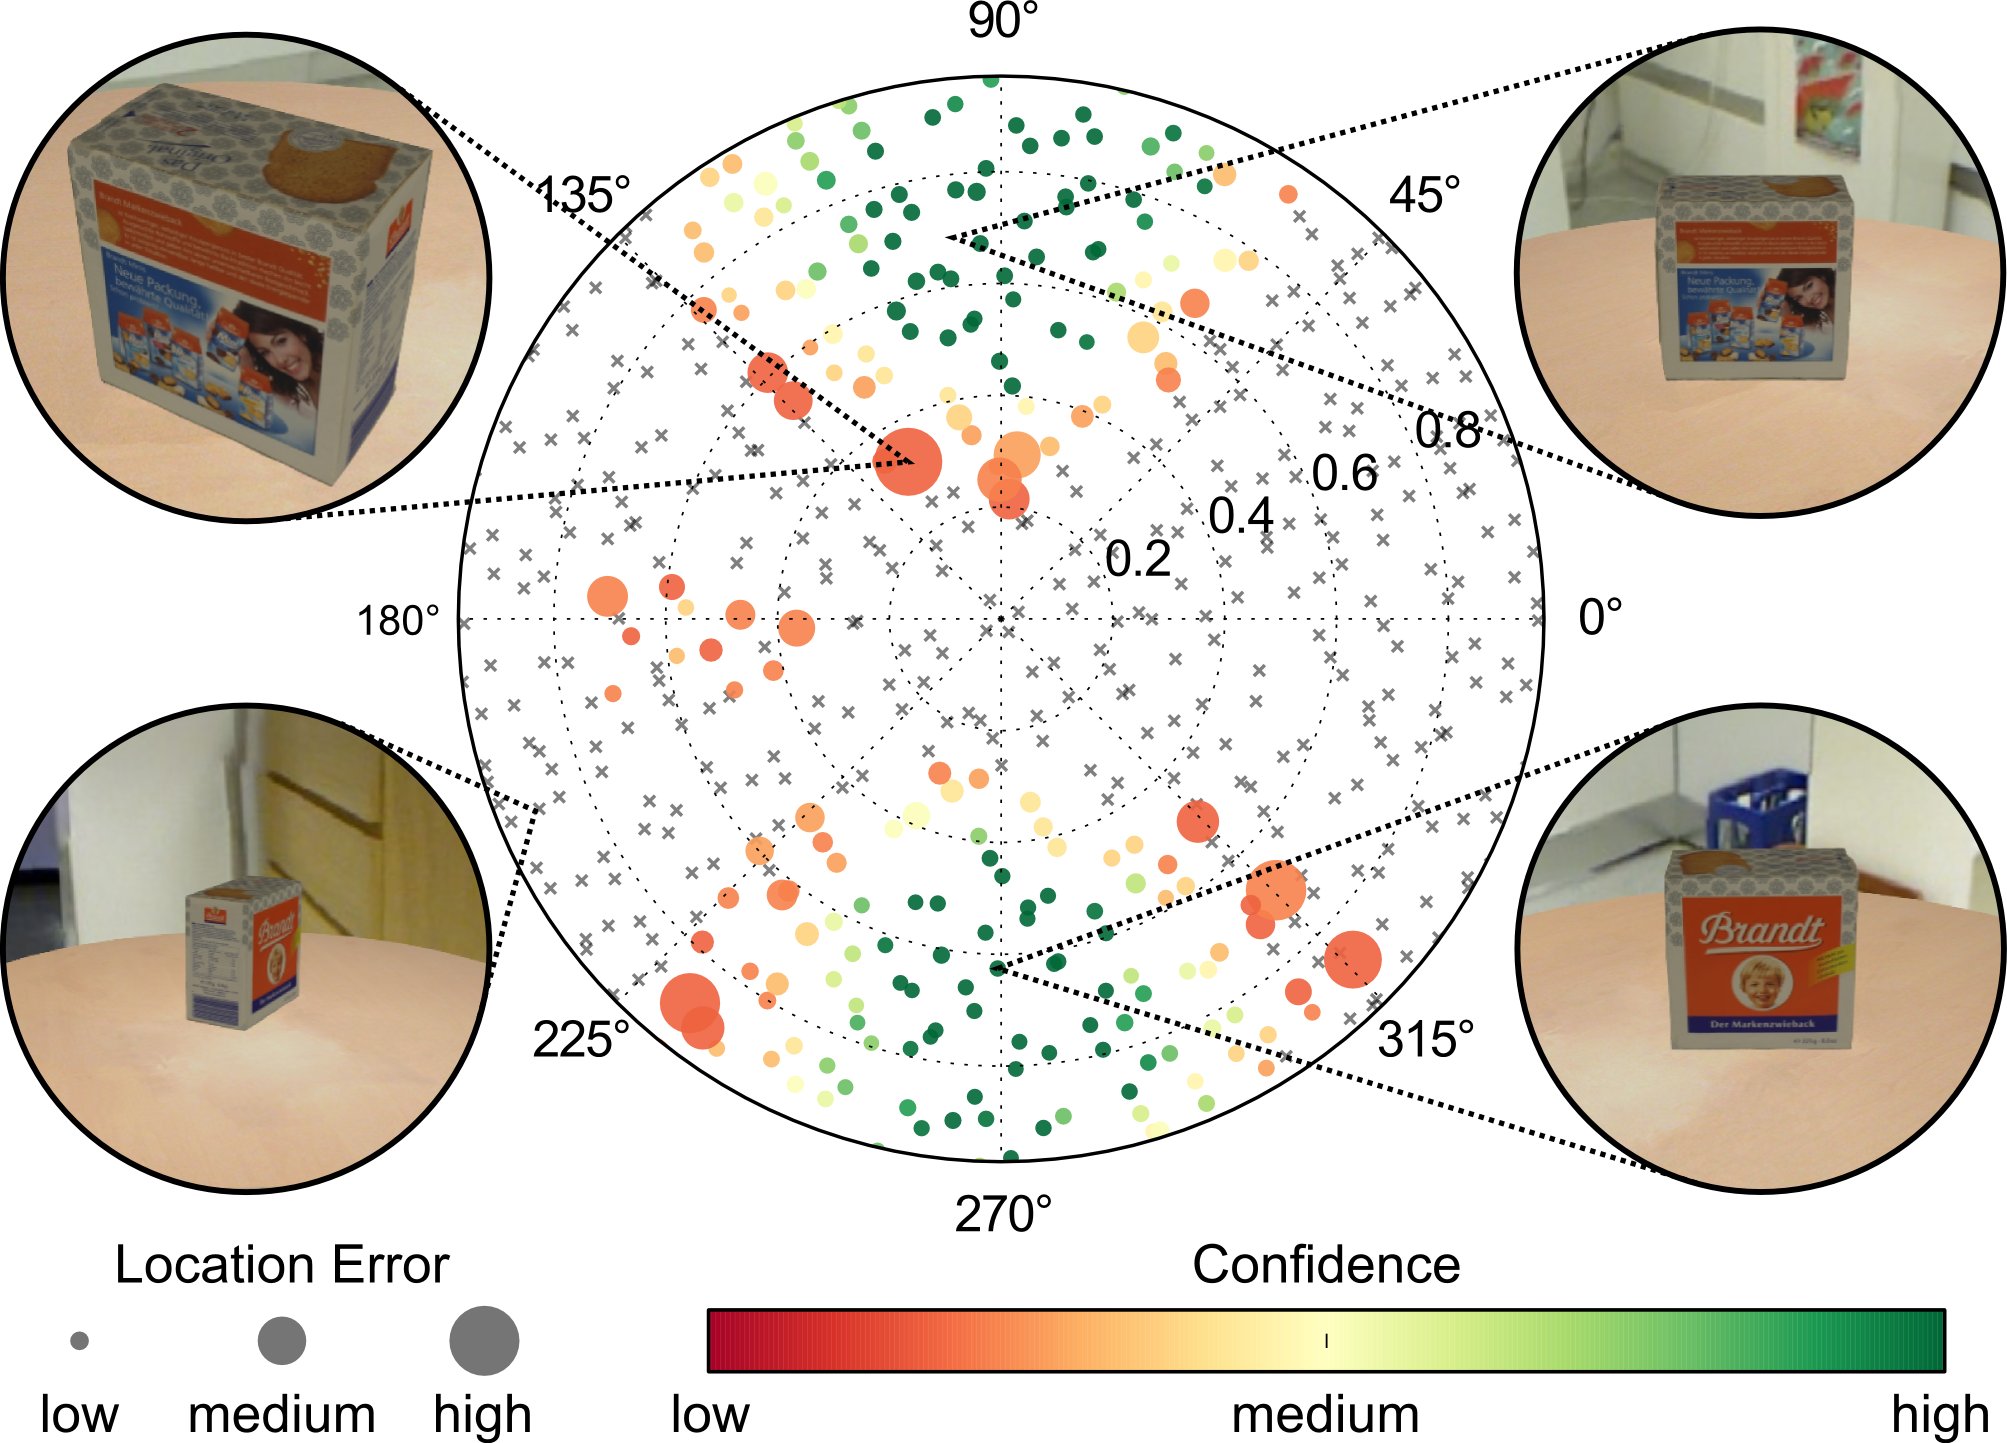
From this test run and its visualization we can derive that the confidence measure is good – no large green dots, but the object is detected only in few orientations. (Enjoy yourself by finding more conspicuities.)
Another example addresses the influence of lighting conditions, i.e. energy of emitted light, strength of attenuation, and contrast between background and foreground brightness. The tests are done with linearly changing each of these parameters for a pair of stereo cameras. In the diagrams below, the small images aside of the diagrams show the test stimuli for the corresponding border values of parameter ranges.
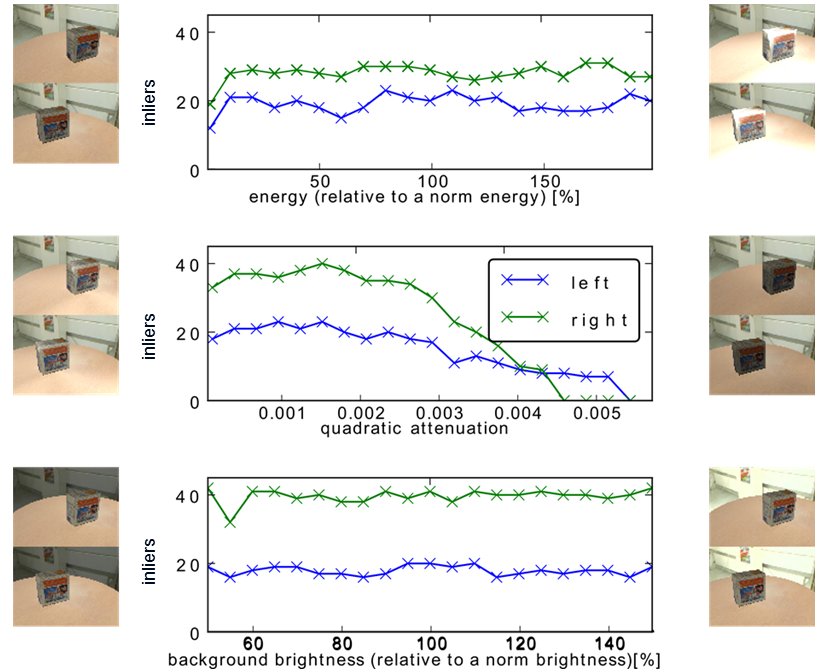
The left camera (upper images in pairs) shows poorer results than the right camera due to the more off-center position of the object in its scene view. While the SUT appears rather insensitive to changes in energy and background brightness, it is sensitive (quadratic) attenuation. Again, more characteristics of the SUTs could be derived from these test results.
For providing realistic objects in generated test data, special equipment was used for high-quality 3D-capturing.