Aerial Collision Avoidance
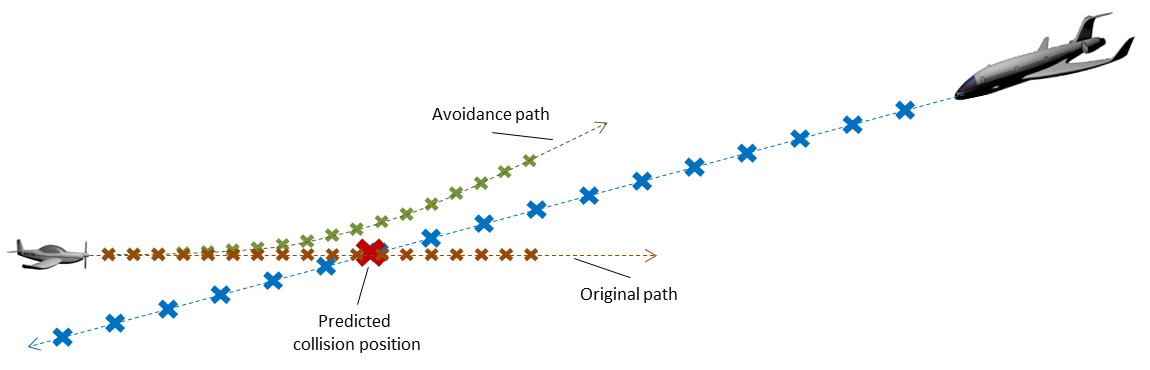
“Sense and avoid” means that flying objects automatically sense other flying objects that can can potentially collide with itself and perform evasion maneuvers in the case of a real collision risk.
One inexpensive possibility to sense such objects is with cameras. For the detector component of a corresponding computer vision component, the domain model was developed and test data generated in the process of the research project DVKUP (funded by the Austrian “Take-off” programme). To limit the variety of situations to address, following flight constraints were given:
- Altitude range: 200 – 2.000 m
- Flight speed. 100 – 200 km/h
- Daylight only (no night flights)
- No flights during thunderstorms and rain
- No flights into clouds
- b/w-cameras used
This led to a domain model with following main components:
- Flying objects (type, numbers, motion)
- Background clouds
- Terrain
- Lighting and haze
Following items were chosen to instantiate these categories:
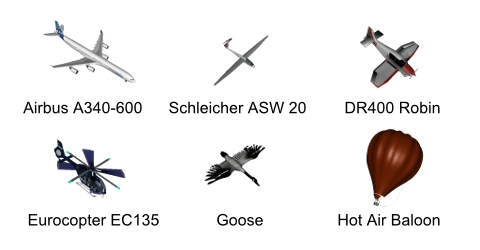
Flying Objects
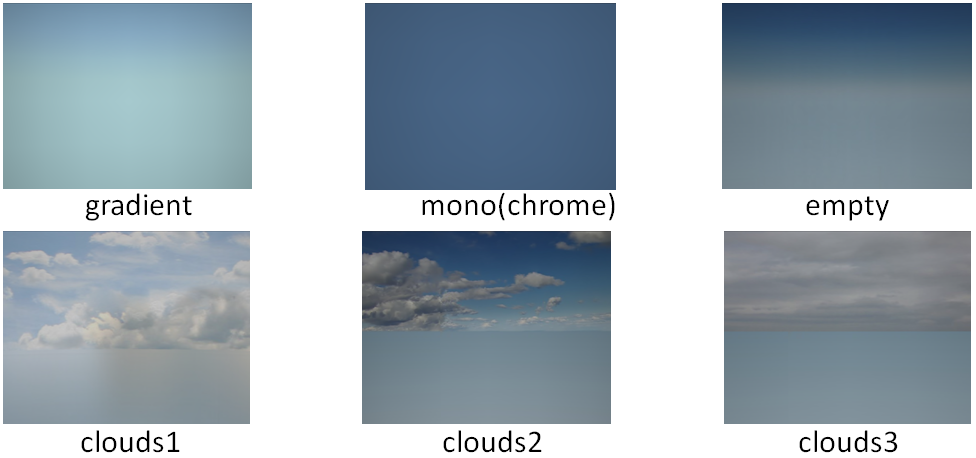
Sky and Clouds
 Terrain
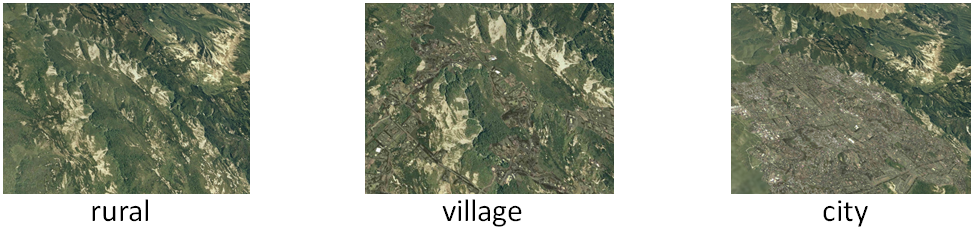 Brownish spots mostly belong to buildings.
Test Result Examples
In the following examples, for each cell 32 test sequences were generated, each of length 20. The first 4 frames of each sequence were not considered for evaluating the detector’s response to allow its settling, because test showed that error rates dropped signficantly after 4 frames. The 16 remaining frames of each sequence were then treated as individual tests. The metric used for comparing the results of the SUT to the Ground Truth (GT) is an adaption of Multi Object Maximum Overlap Matching (MOMO) of [Özdemir e.a. 2010] to the needs of the aerial-object detection application.
Please note that following example results do not represent the performance of the final system! They shall only demonstrate the potential of VITRO!
False Alarms
A test suite was carried out without any flying objects, in order evaluate under which situations false alarms are generated.
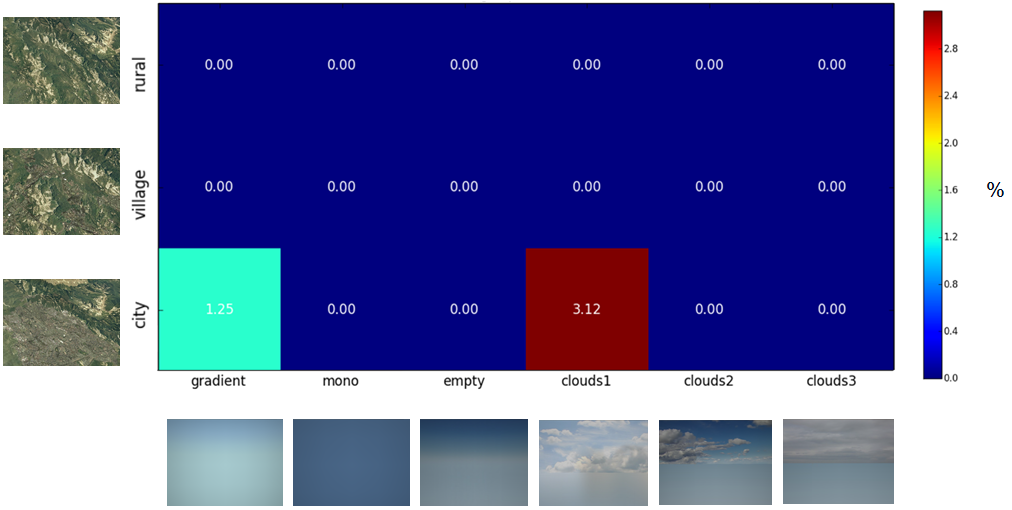
For each pair of sky and terrain, the value gives the number of frames (of 32×16 = 512) in which flying objects were erroneously detected. The 32 sequences were distributed in a squere sorrounded by sky and terrain with small geometric discrepancy.
Missed Detecions
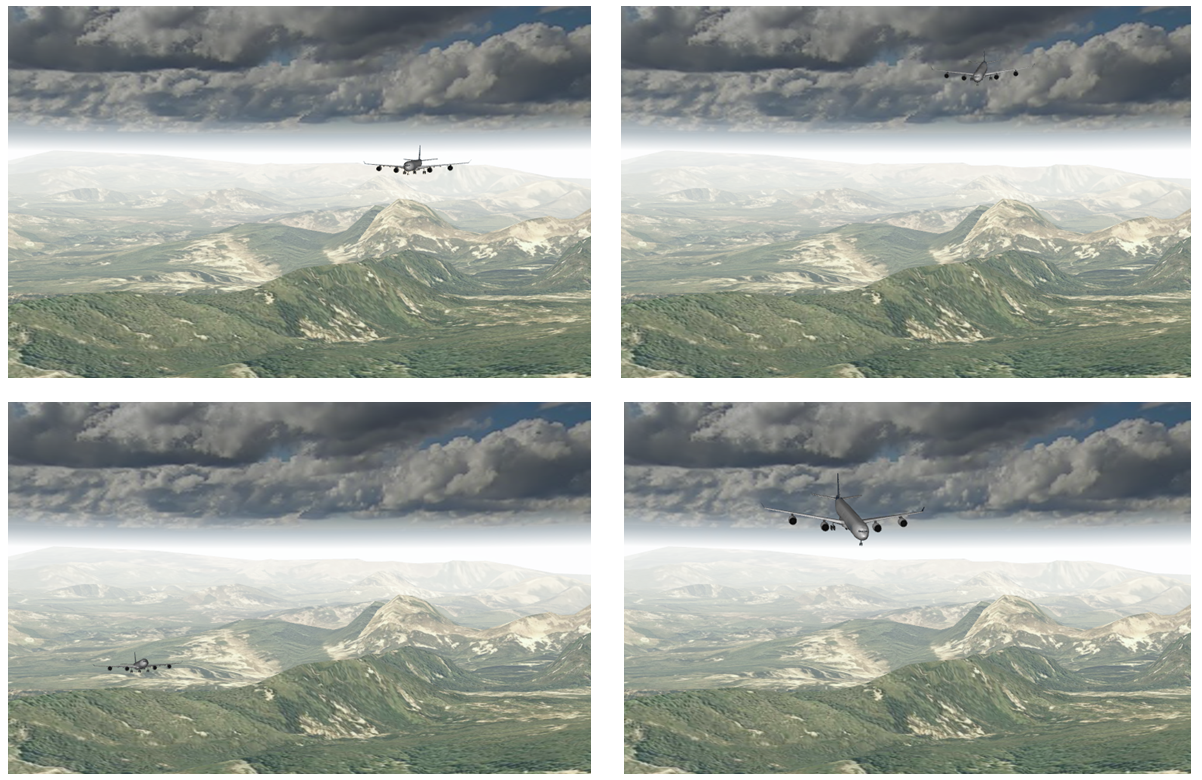
Next step was to assess how good flying objects are detected. Given the flight speed of the own airplane, all objects besides A340 are slower; therefore, the corresponding boxes in the diagram below are white.
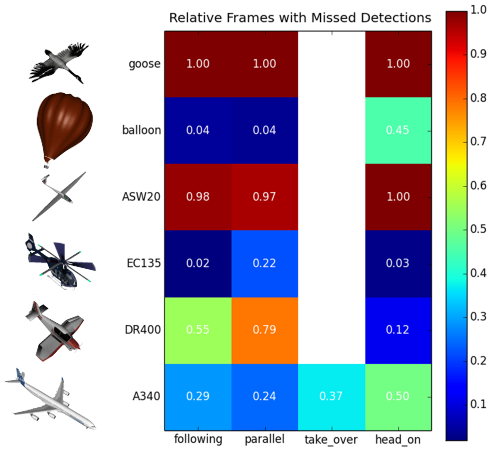
Meanings: “following” – the own airplane follows the object(s), “parallel” – the own aiplane flies parallel to the other, “take_over” – the other object takes over the own, “head_on” – the other object is approaching the own head on.
As before, 32×16 = 512 frames where used for each combination. The number in each cell gives the fraction of frames where the object was not detected. As easily deriveable from the picture, slim objects like geese and gliders are not detected, while for other objects the encounter mode is important.
Head On Collision
To scrutinize more the sensibility of the tested algorithm with respect to head on situations, about a hundred sequences with an A340 were generated on head on collision course with all but starting position kept constant to investigate direction dependency only. The result is illustrated below, mapping the space before the own airplane to the three main projection planes. Arrow colors represent the fraction of images where the A340 is not detectd.
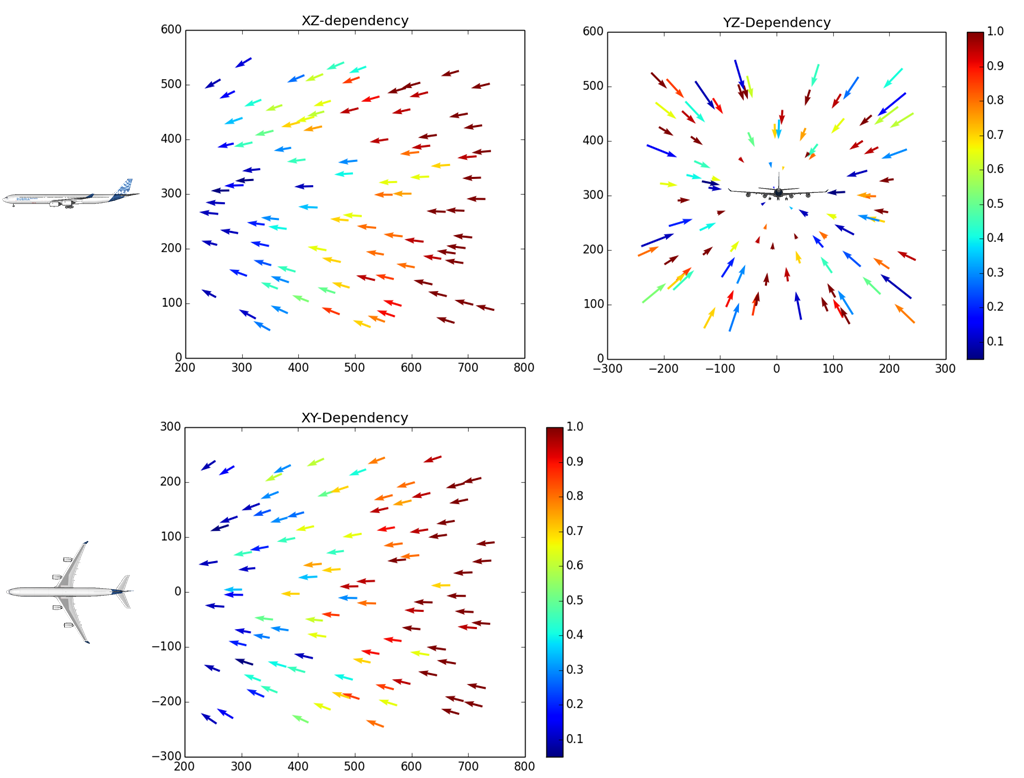
With little surprise, the A340 was less detected the larger the starting distance of a sequence was. At low distances, it was detected with high probability even if coming from aside (dark blue arrows in corners of XZ and XY). While no anisotropy is recognizable with respect to orientation (YZ diagram), the XY diagram indicates that detection is deferred if the A340 approaches directly from upfront than from aside (red arrows in the center of the XY diagram). Presumably, more tests would be necessary to confirm this observation.