Evaluation and Visualization
The evaluation of test data can be separated into two interdependent steps:
- Metrics: how do we compare expected results and the systems output
- Interpretation: how can we interpret the errors that where made
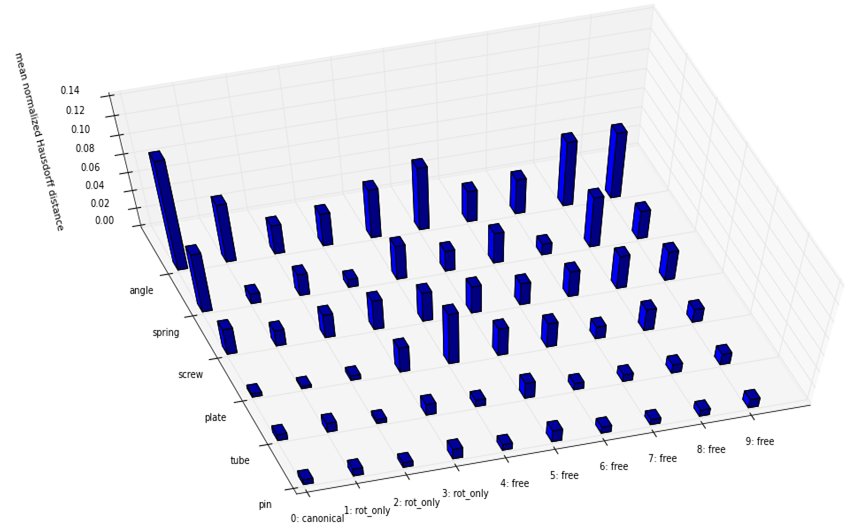
Graphical representation of test results is key to interpret test results and to find possible reasons of errors in systems under test. Hence a broad spectrum of visualization methods has been integrated into the VITRO tool set.

![Object-Centric Error Evaluation [mm]](https://vitro-testing.com/wp-content/uploads/2015/11/ZG3D_Results-Screw.jpg)
![Object-Centric Error evaluation [mm]](https://vitro-testing.com/wp-content/uploads/2015/11/ZG3D_Results-Angle.jpg)
![Parameter-Space Evaluations [m]](https://vitro-testing.com/wp-content/uploads/2015/10/DVKUP_Head-On_Results.png)
![Confidence vs. Error Evalutaions [m]](https://vitro-testing.com/wp-content/uploads/2015/05/Fig3.jpg)